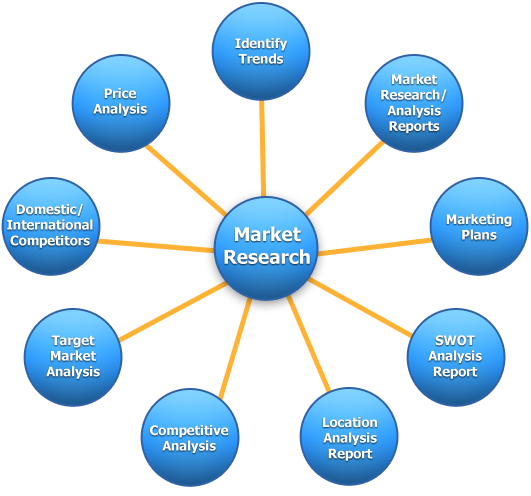


The food and beverage, medical, cosmetic, and personal care product industries all make extensive use of self-adhesive labels. The rising need for ease of use and the necessity of product variety are anticipated to drive the market forward in the years to come. Demand for packaged food and beverages, expansion of the online retail sector, and rising interest in RFID-based labels all contribute to the expansion of the market. Asia-Pacific countries like China and India account for a disproportionate share of worldwide sales. This is because of factors including the expansion of the online retail sector and rising consumer demand for packaged food and drinks. Demand for healthcare products and the expansion of the online retail sector have helped make North America and Europe sizable markets as well. Overall, the future seems bright for the self-adhesive labels industry around the world. The rising use of RFID-based labels, the expansion of the online retail sector, and rising expectations for convenience all play a role in this development. While Asia-Pacific is where most business is done, the United States and Europe are equally important due to rising healthcare needs and online shopping popularity.
classification system
In order to prevent the labels from clinging to unintended places, release liners are included with pressure-sensitive labels. Many businesses rely heavily on self-adhesive labels with release liners for their packaging and labeling needs. Paper is used in nearly all release liners because of its low price and wide availability. The remaining labels have film release liners, which are more expensive but also last longer than paper liners. Labels' adhesive sides are protected from dust and other small particles that can adhere to them and reduce their sticking power. Increasing demand from the food and pharmaceutical industries is likely driving the release liner market.
Linerless refers to rolls of pressure-sensitive BOPP, paper, or polymer film that do not include backing paper. They are coated with hot melt adhesives, either short-term or long-term depending on the situation. Wraparounds for bottles, package labeling, and packaging are just a few of the many industrial uses for this material, which is popular because of its availability in a wide range of colors, lack of backing paper, user-friendliness, cost-effectiveness, and aesthetically pleasing nature. In addition, when compared to conventional adhesive labels with backing paper, the weight of the roll is drastically reduced, increasing the reel capacity and drastically decreasing transportation costs by 15% to 30%. As people become more conscious of the negative effects that paper waste can have on the environment, they are shifting their purchasing habits to favor products like linerless adhesives that produce less waste. Demand from industries and businesses for more eco-friendly and cost-effective labeling options is expected to drive market expansion.
Evaluation Through Use
Due to customers' busy schedules, the food and beverage industries captured the lion's share of the global market. This is because of the rising popularity of convenience foods. The labels on food products contain crucial information such as the date of production and the date of use by. Several groups, for instance, have made it law that producers indicate ingredients, use-by dates, and recommended storage conditions. As the demand for pre-packaged, ready-to-eat meals rises, so does the need for food and beverage labels. Zomato, Uber Eats, and Swiggy are just a few of the newer food delivery firms that brand and seal parcels with self-adhesive labels and tapes. This factor is expected to drive market growth.
The government has specified that the names of the compounds and the amounts of each ingredient in pills, tablets, and other pharmaceutical items be clearly labelled. To avoid the risk of contamination, pharmaceuticals are manufactured under stringent conditions. For instance, the metric system must be used for the precise description of medications and the disclosure of their net content in terms of volume, measure, weight, and other parameters, as specified in Section 96 of The Medicines and Cosmetics Regulations Act of 1945. Therefore, medical drugs require unique labeling that differ from the norm. The adhesive must be able to withstand freezing conditions, the ink must meet pharmaceutical standards, and the label itself must not injure the product in any way.
Strategic Market Shifts
Digital printing's popularity is on the rise since it has transformed the market for self-adhesive labels by reducing production times and prices and expanding creative possibilities for label layout. This has led to an increase in the popularity of digital printing for making adhesive labels. Automation and Industry 4.0's New Normal: Many businesses are trying to find more effective ways to produce self-adhesive labels to meet the rising demand. This is driving the adoption of automation and Industry 4.0 tools, which can boost efficiency, tighten quality assurance, and speed up production for businesses.
Report Coverage
Global Self-Adhesive Labels research report categorizes the market for global based on various segments and regions, forecasts revenue growth, and analyzes trends in each submarket. Global Self-Adhesive Labels report analyses the key growth drivers, opportunities, and challenges influencing the global market. Recent market developments and Self-Adhesive Labels competitive strategies such as expansion, product launch and development, partnership, merger, and acquisition have been included to draw the competitive landscape in the market. The report strategically identifies and profiles the key Self-Adhesive Labels market players and analyses their core competencies in each global market sub-segments.
| REPORT ATTRIBUTES | DETAILS |
|---|---|
| Study Period | 2017-2030 |
| Base Year | 2022 |
| Forecast Period | 2022-2030 |
| Historical Period | 2017-2021 |
| Unit | Value (USD Billion) |
| Key Companies Profiled | Avery Dennison Corporation, CCL Industries Inc., UPM Raflatac, Multi-Color Corporation, Constantia Flexibles Group GmbH, Huhtamaki Oyj, 3M Company, Coveris Holdings S.A., Mondi Group, Sappi Limited, Lintec Corporation, Fuji Seal International Inc., Inland Label & Marketing Services, LLC, Luminer Converting Group, Inc., NAStar Inc., Reflex Labels Limited, Americk Packaging Group, Skanem AS, Labels Unlimited Inc., Consolidated Label Co. |
| Segments Covered | • By Product |
| Customization Scope | Free report customization (equivalent to up to 3 analyst working days) with purchase. Addition or alteration to country, regional & segment scope |
Key Points Covered in the Report
- Market Revenue of Self-Adhesive Labels Market from 2021 to 2030.
- Market Forecast for Self-Adhesive Labels Market from 2021 to 2030.
- Regional Market Share and Revenue from 2021 to 2030.
- Country Market share within region from 2021 to 2030.
- Key Type and Application Revenue and forecast.
- Company Market Share Analysis, Self-Adhesive Labels competitive scenario, ranking, and detailed company
profiles. - Market driver, restraints, and detailed COVID-19 impact on Self-Adhesive Labels
Market
Competitive Environment:
The research provides an accurate study of the major organisations and companies operating in the global Self-Adhesive Labels market, along with a comparative evaluation based on their product portfolios, corporate summaries, geographic reach, business plans, Self-Adhesive Labels market shares in specific segments, and SWOT analyses. A detailed analysis of the firms' recent news and developments, such as product development, inventions, joint ventures, partnerships, mergers and acquisitions, strategic alliances, and other activities, is also included in the study. This makes it possible to assess the level of market competition as a whole.
List of Major Market Participants
Avery Dennison Corporation, CCL Industries Inc., UPM Raflatac, Multi-Color Corporation, Constantia Flexibles Group GmbH, Huhtamaki Oyj, 3M Company, Coveris Holdings S.A., Mondi Group, Sappi Limited, Lintec Corporation, Fuji Seal International Inc., Inland Label & Marketing Services, LLC, Luminer Converting Group, Inc., NAStar Inc., Reflex Labels Limited, Americk Packaging Group, Skanem AS, Labels Unlimited Inc., Consolidated Label Co.
Primary Target Market
- Market Players of Self-Adhesive Labels
- Investors
- End-users
- Government Authorities
- Consulting And Research Firm
- Venture capitalists
- Third-party knowledge providers
- Value-Added Resellers (VARs)
Market Segment:
This study forecasts global, regional, and country revenue from 2019 to 2030. INFINITIVE DATA EXPERT has segmented the global Self-Adhesive Labels market based on the below-mentioned segments:
Global Self-Adhesive Labels Market, By Type
Linerless
release liner
Global Self-Adhesive Labels market, By Application
Food & beverage
pharmaceutical
household & personal care
consumer goods
others
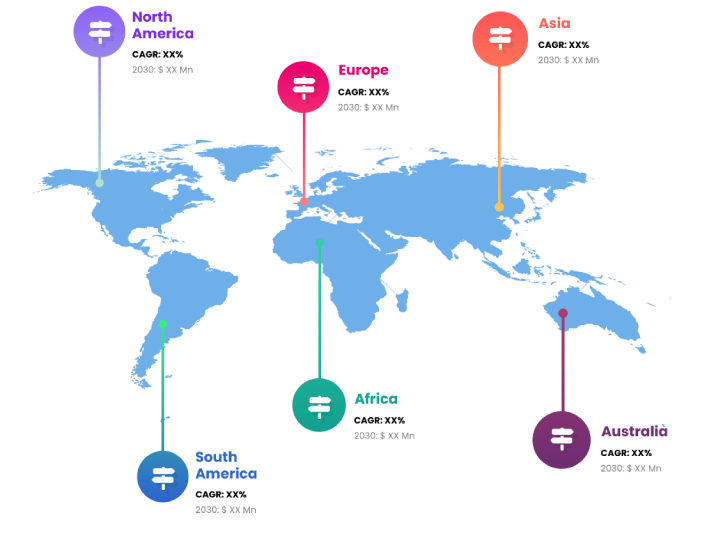
Global Self-Adhesive Labels market, Regional Analysis
- Europe: Germany, Uk, France, Italy, Spain, Russia, Rest of Europe
- The Asia Pacific: China,Japan,India,South Korea,Australia,Rest of Asia Pacific
- South America: Brazil, Argentina, Rest of South America
- Middle East & Africa: UAE, Saudi Arabia, Qatar, South Africa, Rest of Middle East & Africa
You will get in-depth and extensive self adhesive labels market market research and competitor analysis for your business to help you develop more profound insights into the self adhesive labels market Market.
Through INFINITIVE Data Expert is a professional Market Research services, I will identify the self adhesive labels market market size, demand & opportunities, growth rate, and target audience with a comprehensive analysis of your competitors.